TLDR
(click to show/hide)
I consider myself to be a self-tracker; someone who keeps a record of some form of data to look back on at some point in the future. My most dedicated
form of tracking is my calendar, which in this article I analyze to find some interesting trends in how I spend my time.
For a while now, I've been keeping a detailed calendar for myself, both to efficiently pack my goals into relatively little free time
and as a means of recording how my time was actually spent. Without much overhead (an hour or two of week total) to maintain,
I've gained what I feel has been a much more productive use of my time and a sort of memex
tracking what I've done over the past 2.5 years (with about 30 minute precision).
I enjoy the increased foresight that this practice has given me and its a nice bonus to be able to tell you what I was doing on any exact day
at whatever exact time. I would encourage others to try keeping their own calendar with this level of detail since the benefits definitely extend beyond
the workplace which people typically use them for.
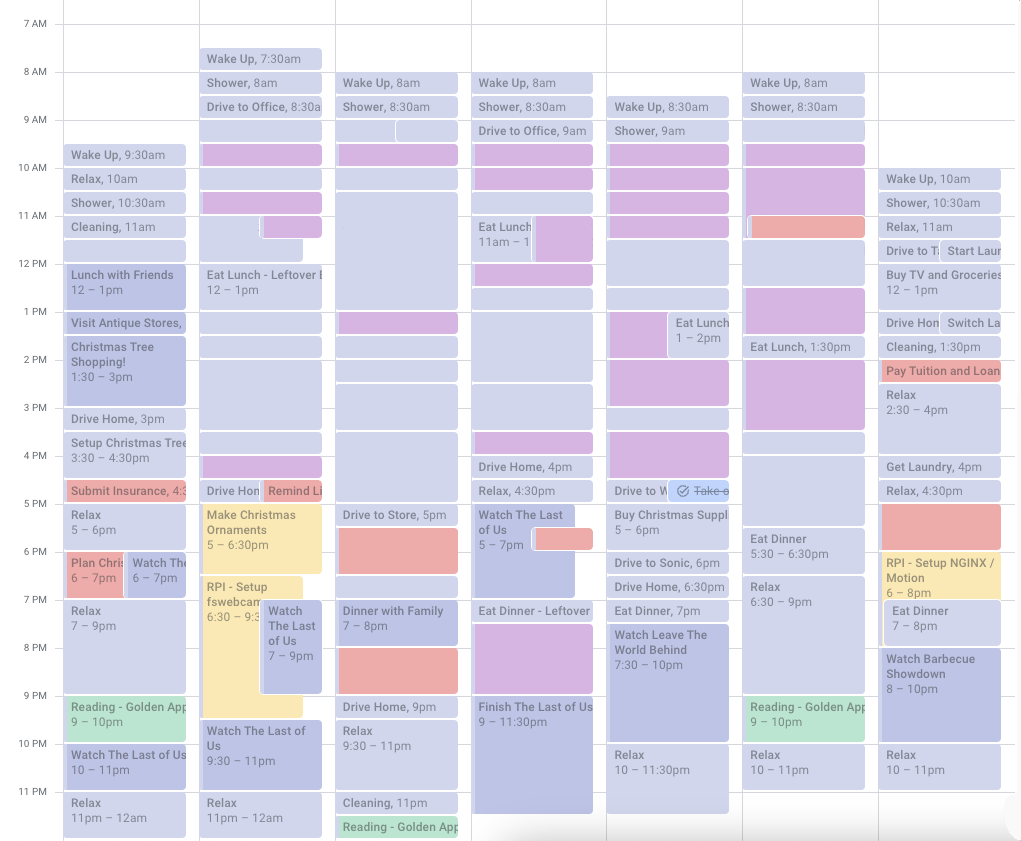
An example of what my calendar looked like for some week in December of last year (with work-related and location-identifying information removed).
However, these sorts of medium-length planning and memory benefits are not what I'm writing about today. Instead, now that I've collected a good amount
of this data, I'm interested in sharing some of my 'personal analytics'. That is, extracting some interesting results from my calendar data, visualizing it,
and perhaps trying to infer / optimize my behavior based on what I find.
A great example of the type of article I'm writing can be found on Stephen Wolfram's blog.
The Quanitifed Self
Taking a step back for a second, this idea of personal analytics lives within a broader context of the Quantified Self,
a cultural phenomenon and community of self-proclaimed 'self-trackers' who maintain detailed records of all sorts of data about themselves. The most common form that you might engage in
even is fitness tracking. Calorie counting, diet apps, Apple Watches, and even pen-and-paper notes about what medications you've taken througout the week fit in this category.
There are a lot of benefits to self-tracking including personalized results, control of your own data (in some cases), and contribution to citizen science
when participating in the larger community. There are some real criticisms of the practice though, aruging that the western idea of striving for the 'optimal self' inherently biases us
against those that are 'non-optimal' (the poor, fat, ill, etc.). There's also a tendency among some self-trackers to realize that an obsession with this sort of behavior can detract from the
overall human experience.
For some time, I did feel that maintenance of my calendar and sticking to my schedule was starting to dominate the actual experiences I had planned for myself. Reading more about the topic
from books like The Quantified Self and Self-Tracking
have since helped me view my calendar as more of a tool for record keeping than the sort of contractual agreement with my past self that it was becoming.
My Data
Now for the fun stuff!
I first had to pull and clean my calendar data which took quite a bit of time. Google Takeout is a handy way of getting
a copy of your data from any of Google's services, but for the calendar, exports in an old ICS format that does not support color. Since I track a large portion of the categorical data for my events with color
I needed to set up a GCP service account, configure OAuth credentials, and write a script to access my events (with color data) in batches. I also truncated my data to
only include events since 01/01/2023 since I had some different color schemes prior to that which I didn't care to try and reconcile.
Across the 12 event types that I track (in addition to me sleeping in the negative space of the events), I counted the total number of each that occured in the last year and a half:
I also put together some colorful summary charts for the aggregated data by month and by week. The categories from bottom to top
are roughly ordered according to their 'necessity' level, sleep and work being the most important and personal projects and relaxation time being less so:
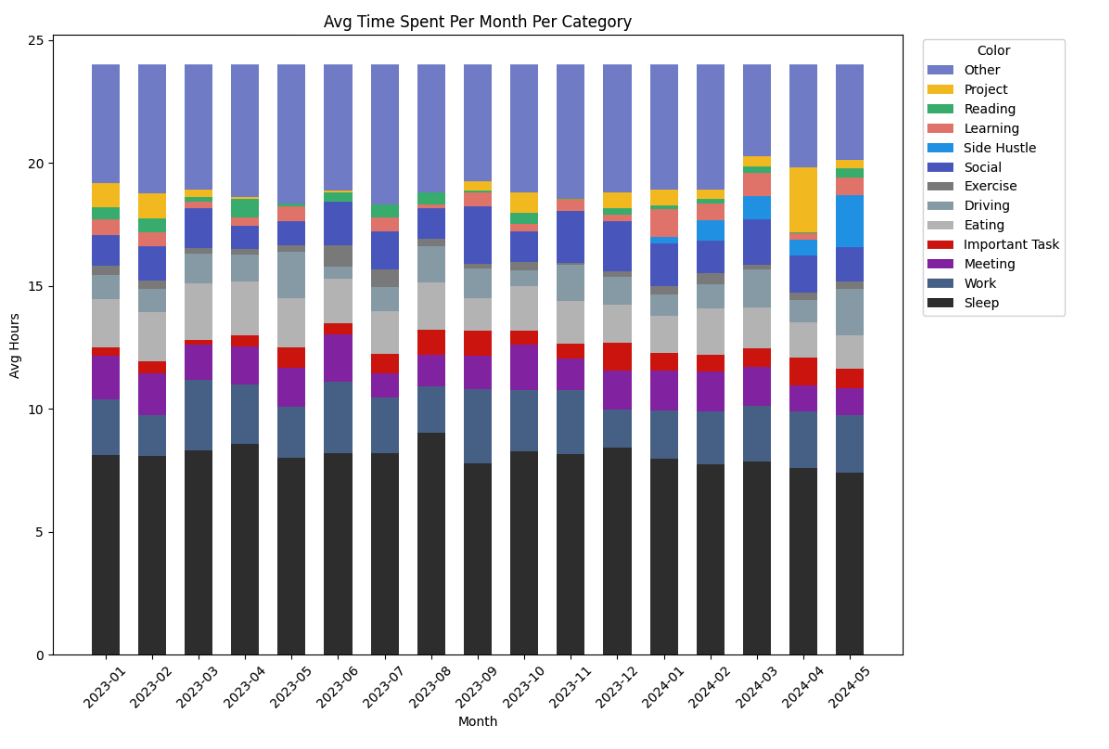
The average number of hours I spent each day doing one of these 13 categories for each month in the last year and a half (2023 - mid 2024).
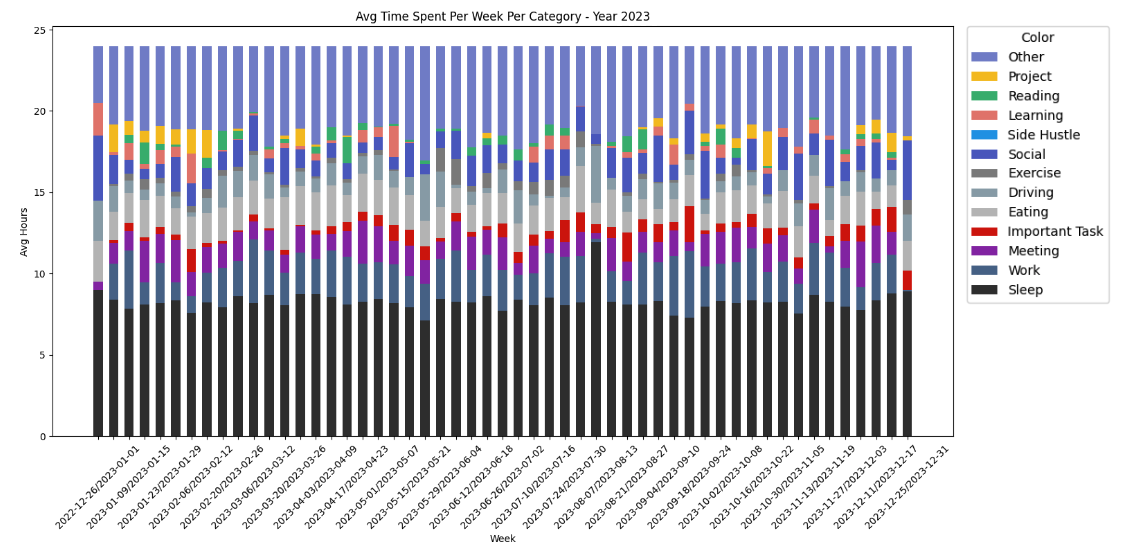
The average number of hours I spent in each category for each week of 2023.
These are interesting for identifying some memorable outliers like that spike of driving and sleeping I did in August of 2023 (on the second chart) which was when
Linda and I made the exhausting drive back from Ann Arbor to Austin and then immediately moved into a new apartment followed by us sleeping for 12 or so hours over the next couple days.
Its also easy to tell when I take a week off of work during the holidays (at the two ends of the second chart) and socialized significantly more with family and friends.
Since one of my unoffical goals has been to utilize my free time more effectively by reading, learning, and working on projects more, I decided to chop out the 'necessary' events
from these charts and take a look at just my free time:
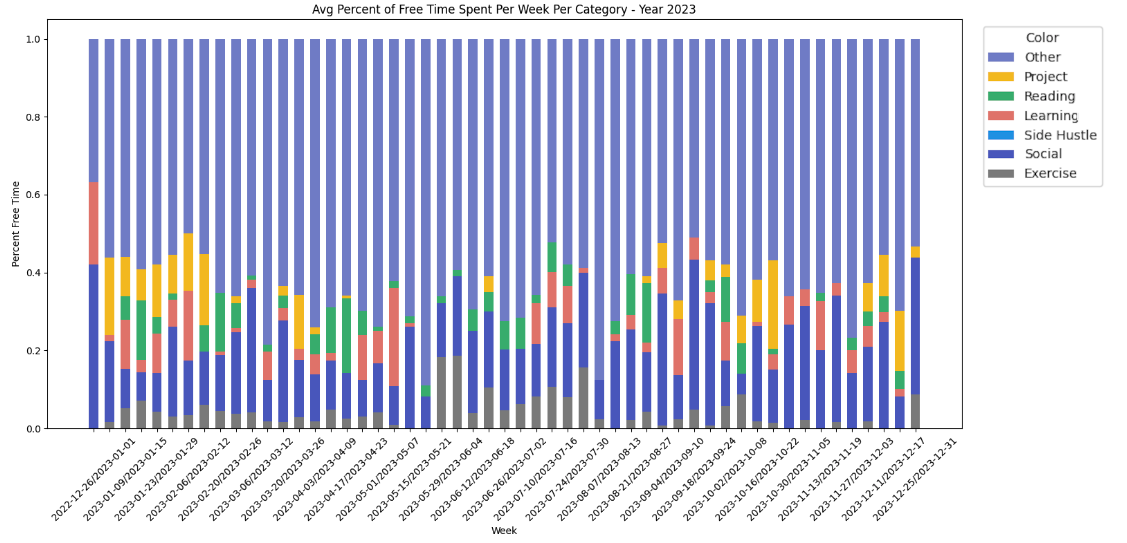
How I spent my free time in 2023.
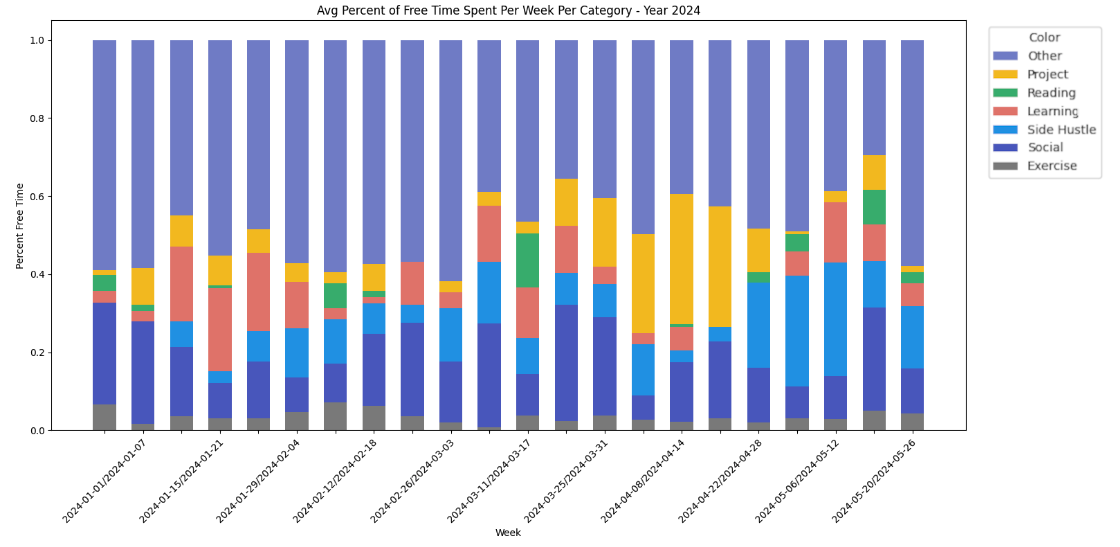
How I've spent my free time so far in 2024.
Some things that are in the 'Other' category I can never get rid of; chores like doing the laundry, washing dishes, and cleaning, taking showers, and allowing myself to just relax
for a minute. In general though, it does seem like a trend is forming of me using some of the 'suboptimal' free-time for growth instead of video games and doom-scrolling (I do still consider
gaming with friends a 'Social' activity, but if I'm playing alone I would prefer one of these other alternatives).
Overall, I do see a nice trend of using more of my free time for personal growth activites in 2024 compared to 2023. For example, you can see me start on my Master's degree
as I started 'Learning' more in early 2024 and more recently how I spent a lot of time focusing on my Learn Anything hackathon project.
Below you can see what my 'daily rhythms' look like as a set of probability distributions representing the chance you will find me engaging in a particular type of activity throughout the day:
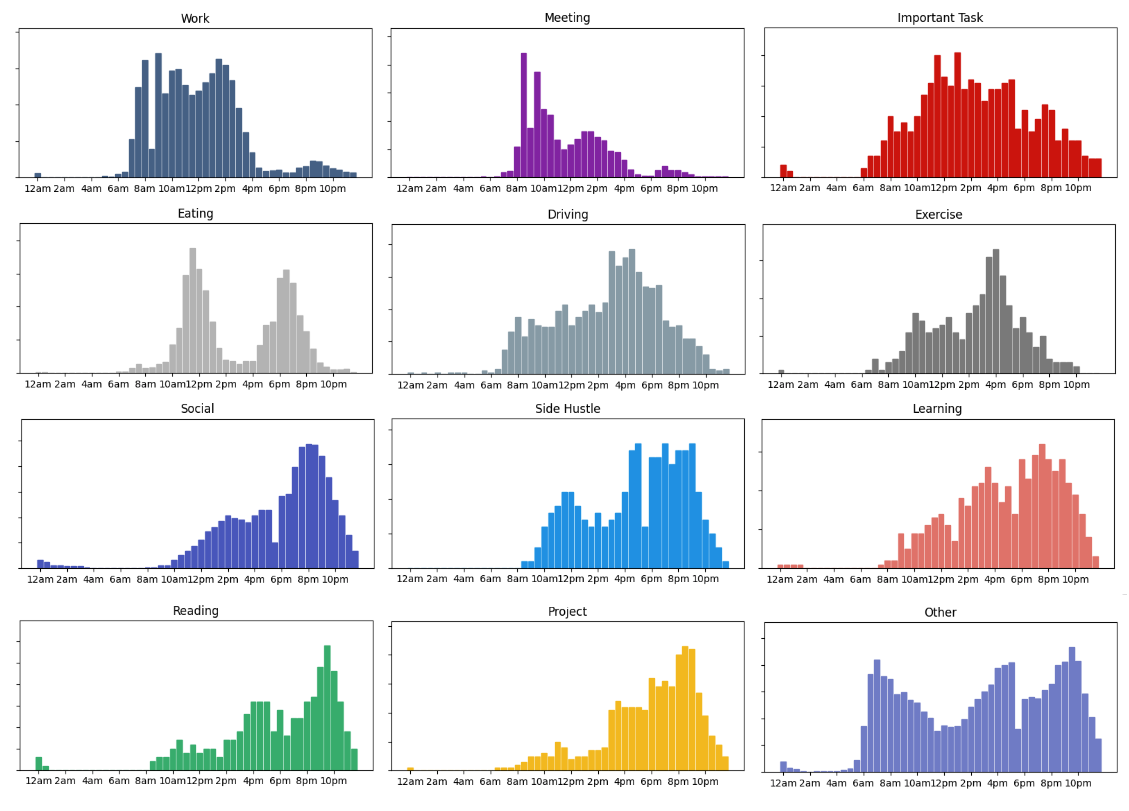
Distributions of event types throughout the day.
Again, some interesting things to point out:
-
My morning standup meetings stick out quite a bit. You can also see the dip in work / meetings when I got to lunch and the little bump in the evening representing our
bi-weekly evening prod deployments.
- I only eat two meals a day, perhaps this is a sign I should start making myself breakfast.
-
The peak in the execise chart is when I take my daily post-work walk around the neighborhood. Since both my work and my free time are spent primary at my desk (since I work from home)
I enjoy doing this as a way to transition my thoughts away from work and towards whatever I'm planning on for my evening. There's a noticeable dip in most of the other charts
where I'm taking this walk and when I'm driving home on the days I do actually go into the office.
-
My reading and project time conflict with one another, primarily because I don't have a lot of room to fit both of those along with studying into my evenings, but something I might try to
balance this is intentionally focusing on reading in the earlier evening and then turning back to projects later in the evening after I've had some extra time away from my desk.
Conclusion
If nothing else, this was an incredibly fun look into how I operate on average day-to-day. I leave this analysis with a few takeways that I'll try to implement as habit over the remainder of 2024 and
some useful scripts to make this sort of overview faster to generate in the future.
My calendar is also only one of a few different things that I keep a detailed record of; I also maintain a similar level of data on my spending habits, my reading habits, and am looking to start
tracking some basic fitness data by getting either a FitBit or an Apple Watch. It will be interesting to see the correlation between some of the more general events I spend my time on and
how those affect my savings and health.
Resources